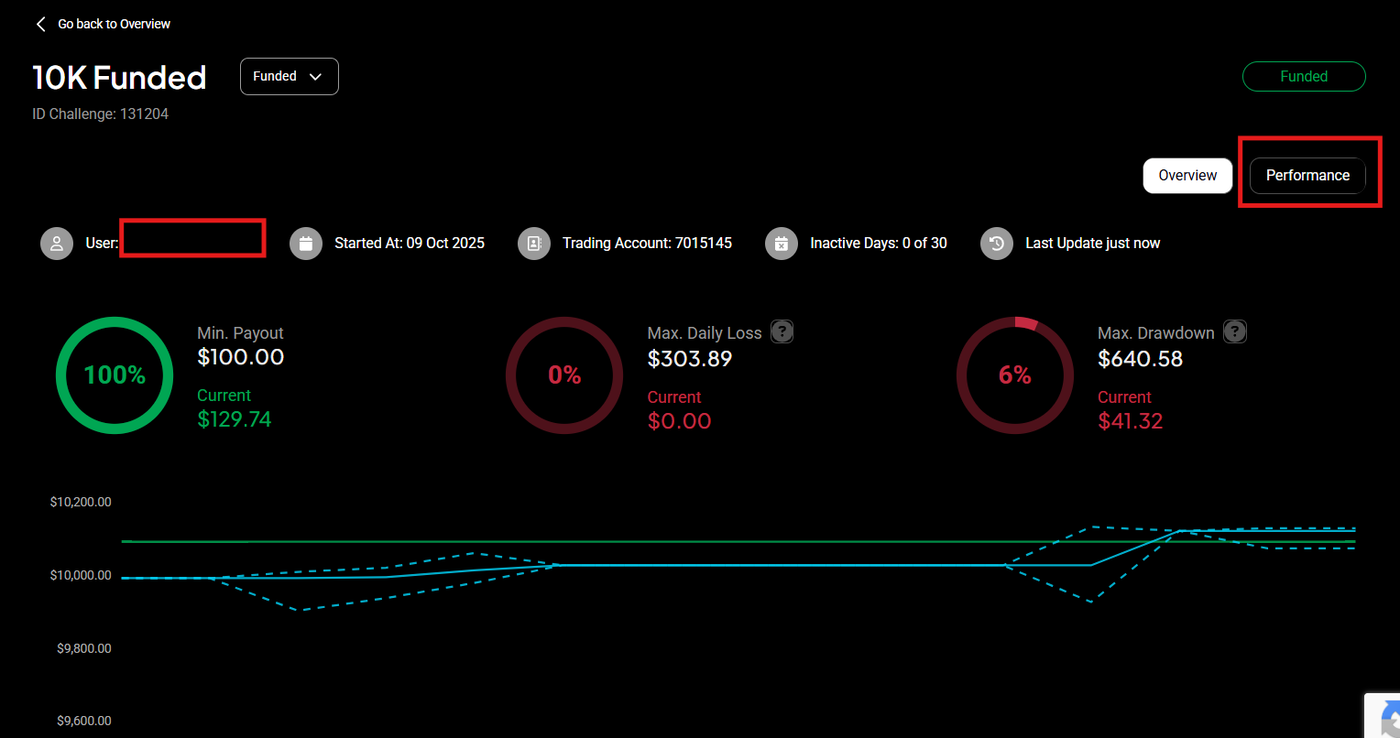
📊 Introducing the New Performance Tab: Advanced Trading Intelligence for Traders & Admins
We are proud to announce the launch of the new Performance Tab and Metrics Suite, now available in both the Trader Dashboard and Admin Panel.
This enhancement delivers a comprehensive, data-driven view of trading activity, empowering smarter decisions, stronger risk oversight, and deeper behavioral analysis.
🔎 What’s New?
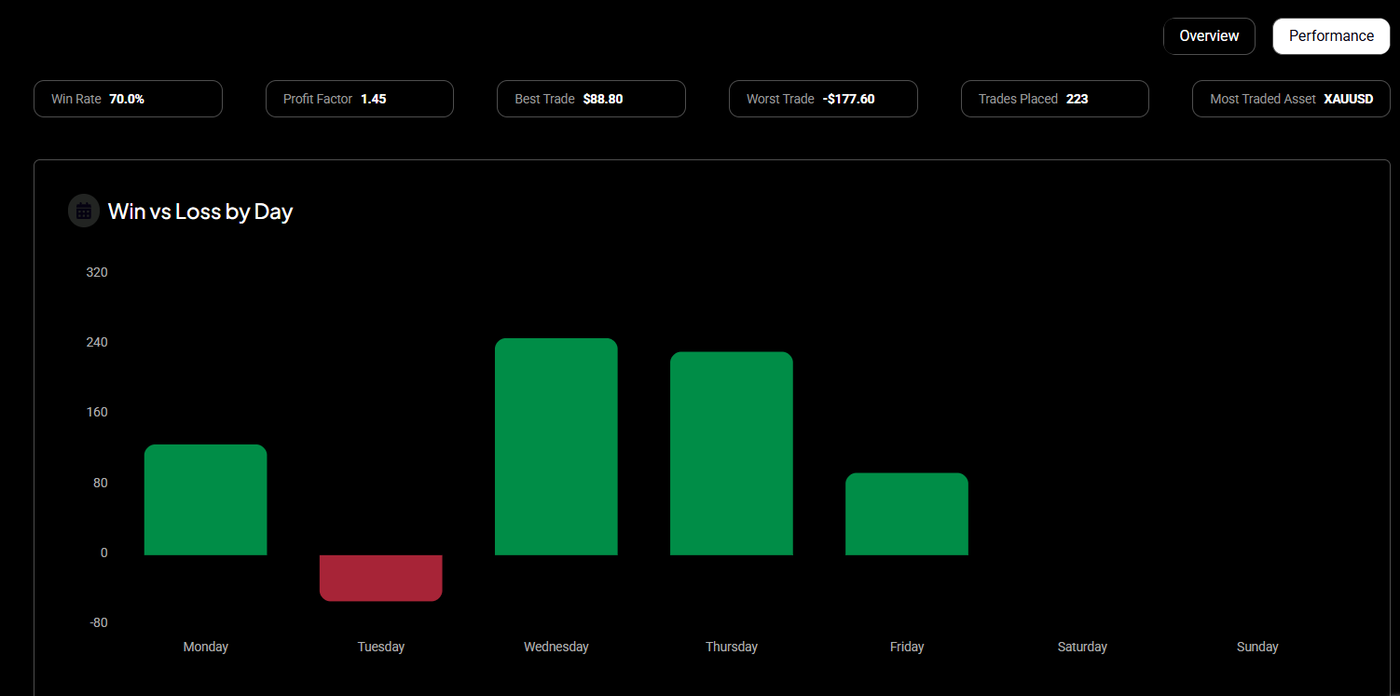
📈 Core Performance Metrics
- Win Rate
- Profit Factor
- Best & Worst Trade
- Total Trades Placed
- Most Traded Asset
These high-impact indicators provide an immediate snapshot of trader consistency, efficiency, and execution quality.
📅 Win vs. Loss by Day
A dynamic daily breakdown of performance, allowing users and administrators to identify:
- High-performance trading days
- Behavioral patterns
-
Risk exposure trends
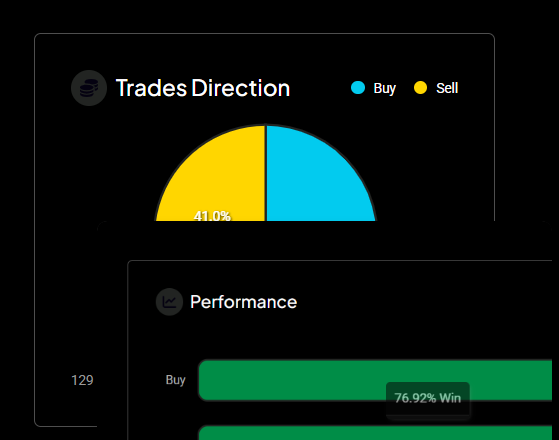
🔁 Trade Direction Analysis
- Long vs. Short distribution
- Percentage breakdown visualization
- Total buy and sell trades
This enables better evaluation of directional bias and strategy alignment.
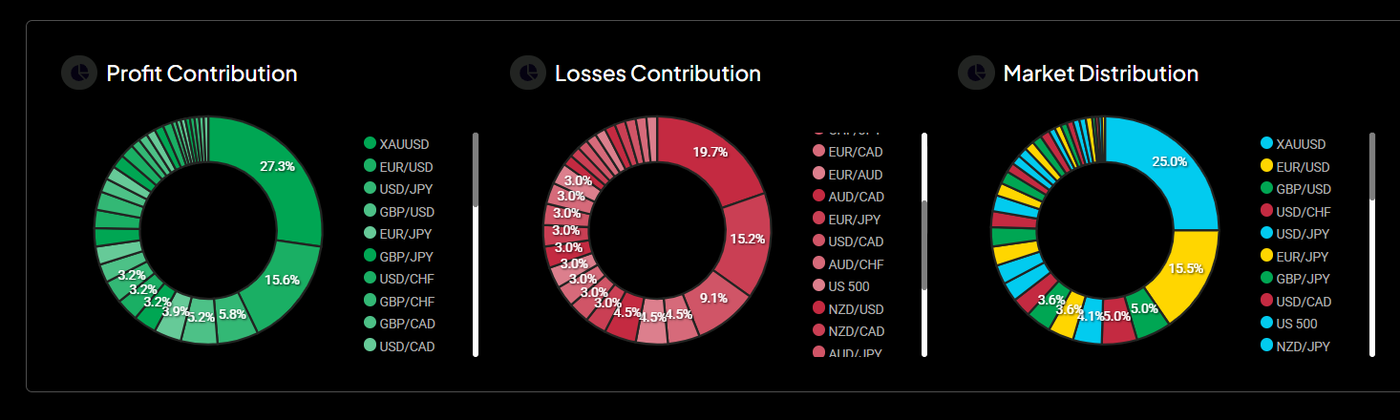
💰 Profit & Loss Contribution by Asset
Clear visualization of:
- Profit contribution per instrument
- Loss concentration per instrument
- Market distribution exposure
Designed to detect overexposure, asset dependency, and strategy imbalance instantly.
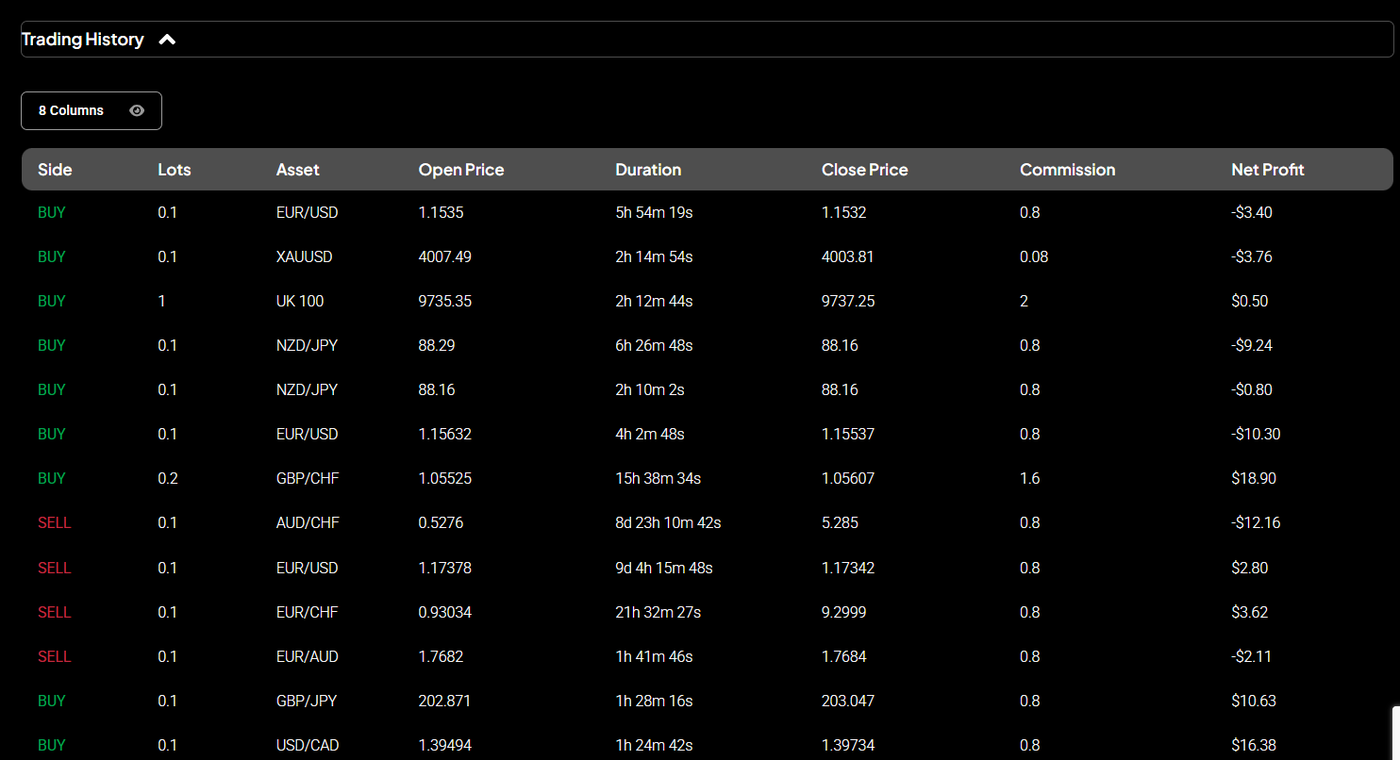
📜 Complete Trading History
A fully structured table including:
- Trade side
- Lot size
- Asset
- Open & Close price
- Commission
- Net profit
Providing full transparency and audit-level visibility for both traders and administrators.
🚀 Why This Matters
This release transforms the dashboard from a tracking tool into a strategic performance intelligence system.
For Traders:
- Greater self-awareness
- Clearer optimization opportunities
- Improved discipline and accountability
For Admins:
- Stronger risk monitoring
- Behavioral analytics at scale
- Faster decision-making for funding evaluations
We continue to build technology that elevates performance standards across the funding ecosystem.
More innovation is on the way.